Good data is the basis for well-founded decisions. This does not only apply to the sale of the new pants model. Digital solutions in particular score highly in this discipline with comprehensive evaluations.
Our digital signage software soviaRetail now offers holistic and customizable data analyzes for all touchpoints. We use the various possibilities of Microsoft Azure Insights. All evaluations can be filtered and sorted.
In this article we give you an overview of what you can get out of your data. We will go into 8 reports that are included as standard in our soviaRetail Backstore. Reports of any kind can, however, always be adapted, expanded or newly created according to customer requirements.
1. Transmission time evaluation:
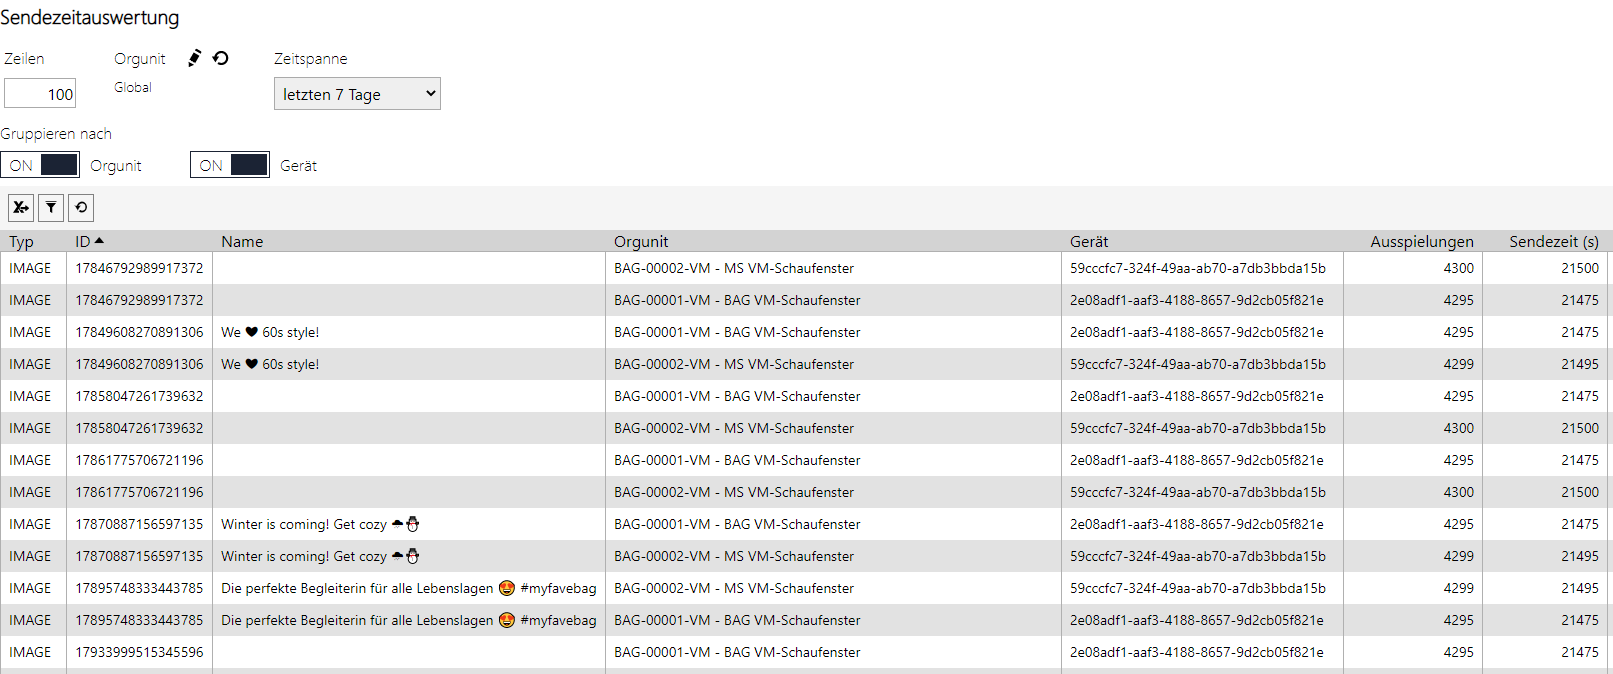
... indicates in seconds which content was played on which device or in which OrgUnit.
Offers added value because:
If a customer wants to resell the digital advertising space to a third party, these statistics provide evidence of display times.
In addition, the table provides general information about which content was displayed particularly often and can help to make adjustments in the playlists if the weighting of the content is too unbalanced.
A similar evaluation also exists on a promotion basis. The number of times a complete promotion (playlist) was played is counted here.
2. Digital signage metrics:
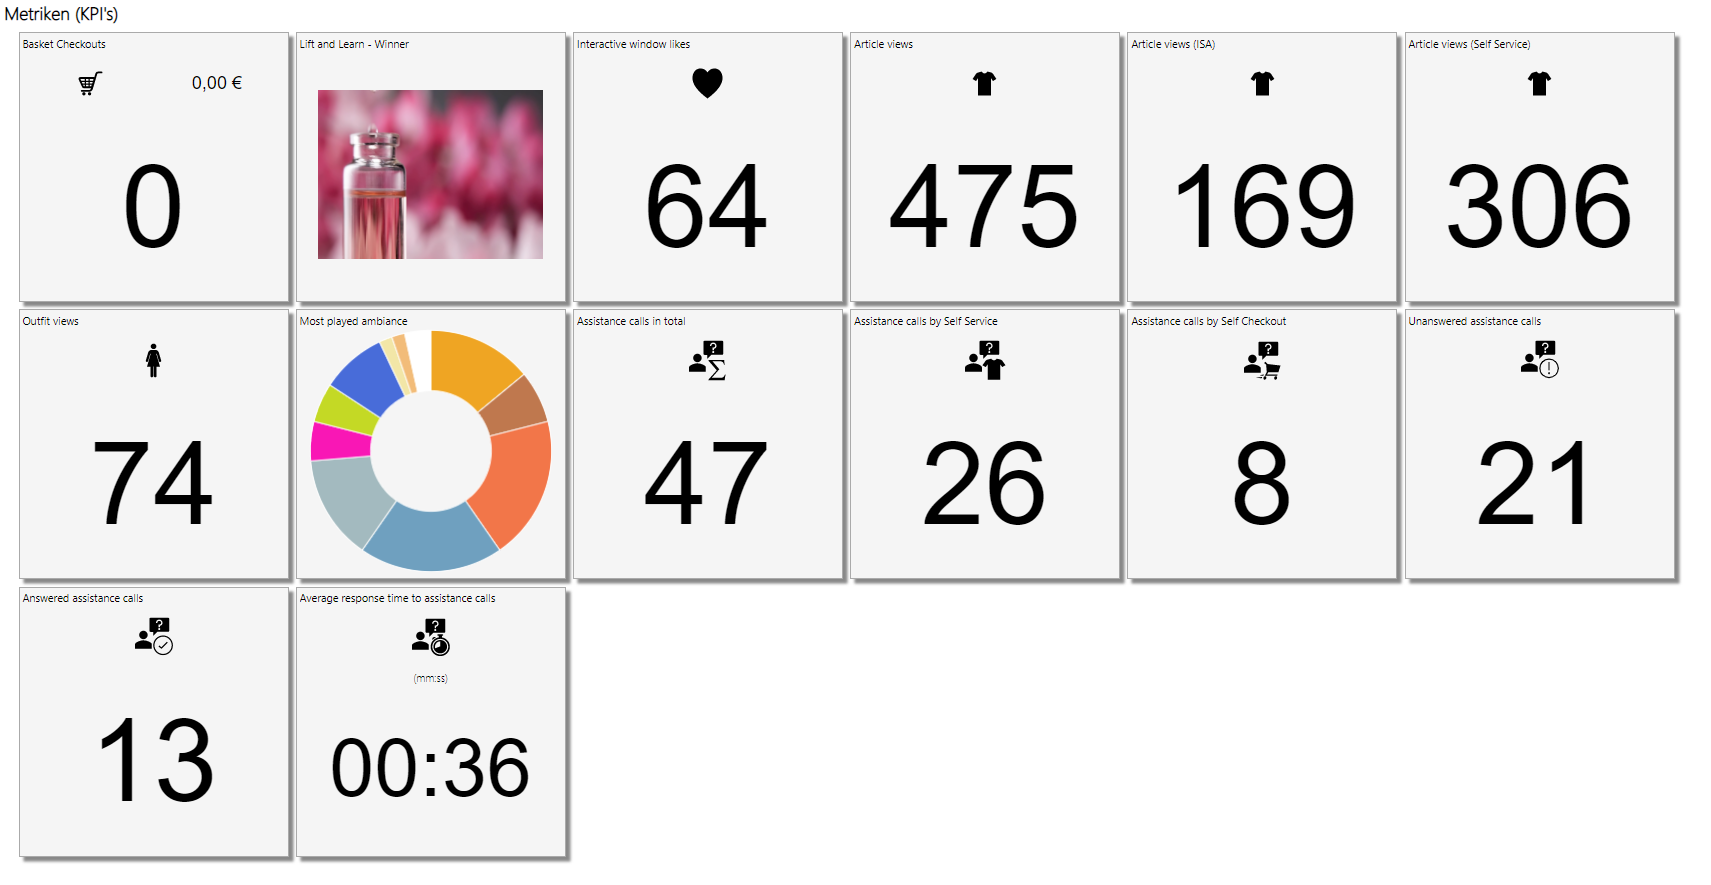
… show an overview of interactions with interactive digital signage and InStore Assistant applications.
Offers added value because:
If you click on the tiles (see picture below) further details are displayed. For example, you can see which article was called up particularly often on Self Service, liked on the interactive shop window, or lifted on Lift & Learn. Whether a dress was picked up in the store and then hung back on the product carrier cannot be measured (as easily) - but the digital equivalent of this action can.
The evaluations by pressing the 'Call for help' button and the response times of the store employees can also provide information on how independently customers accept the digital, interactive solutions and whether the staff on the shop floor (can) take care of those seeking advice.
3. Computer device metrics:
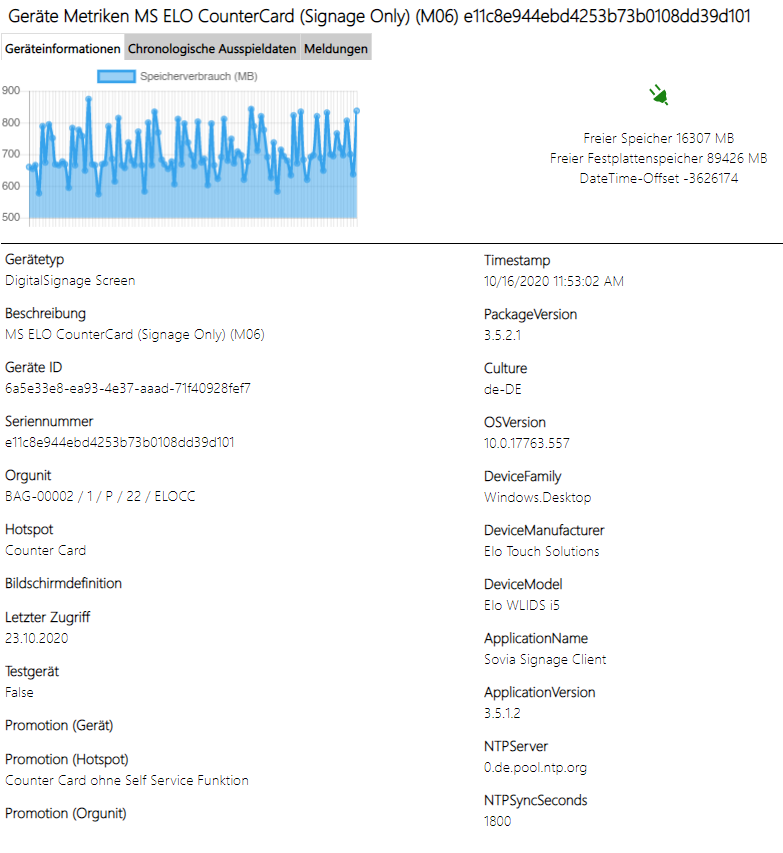
... reveal the “state of health” of the hardware.
Offers added value because:
If one of our PCs doesn't work as expected, this dialog is the first and best clue to get to the bottom of the problem.
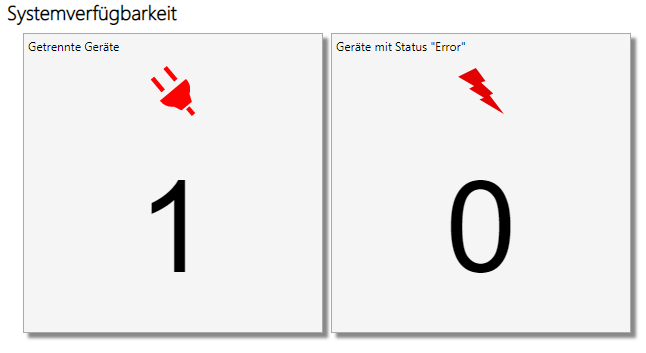
4. System availability
... shows at a glance whether devices are decoupled or whether error messages are displayed.
Offers added value because:
Wir bieten im Managed Service einen SLA an, in dem wir alle Geräte “pro aktiv” monitoren, damit der Kunde sich nicht darum kümmern muss. Die Systemverfügbarkeitsanzeige ist für Support und Kunde eine erste Anlaufstelle, um mögliche Fehler eigenständig zu finden. Getrennte Geräte bedeuten, dass der Azure Server keine Verbindung zum Geräte herstellen konnte und somit keine Netzwerkverbindung besteht. Diese Fehler unter “Error” wird nur bei einem “Content Ladefehler” angezeigt (d.h. zum Beispiel, dass ein Bild nicht geladen werden konnte). Es gibt aber noch eine Vielzahl anderer Fehler, die der Kunden im Backstore nicht sehen kann und nur von unserem Support bearbeitet werden können
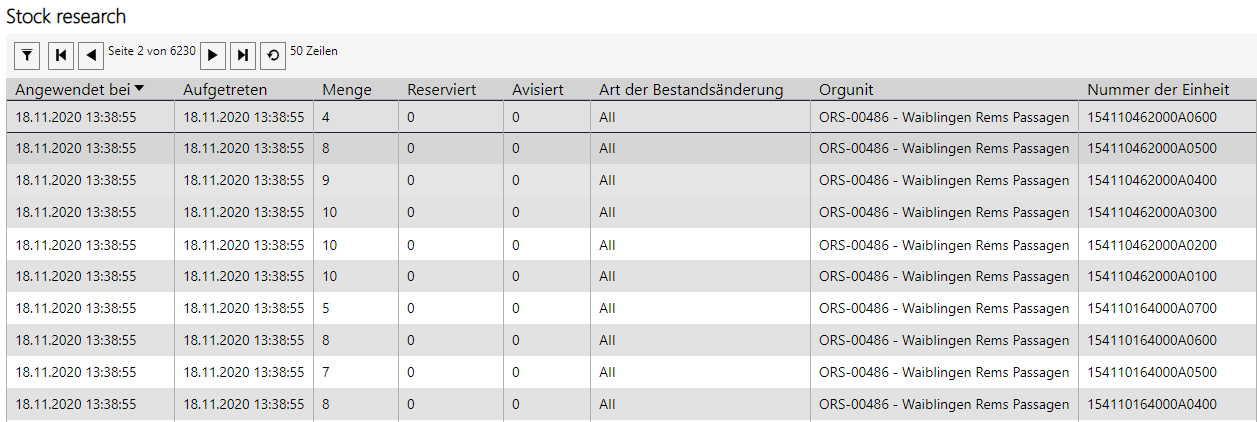
5. Warehouse data
... list which articles are available in which quantities and whether SKUs have been announced or reserved.
Offers added value because:
Just a quick look reveals whether articles are advised or reserved and the inventory is therefore critical.
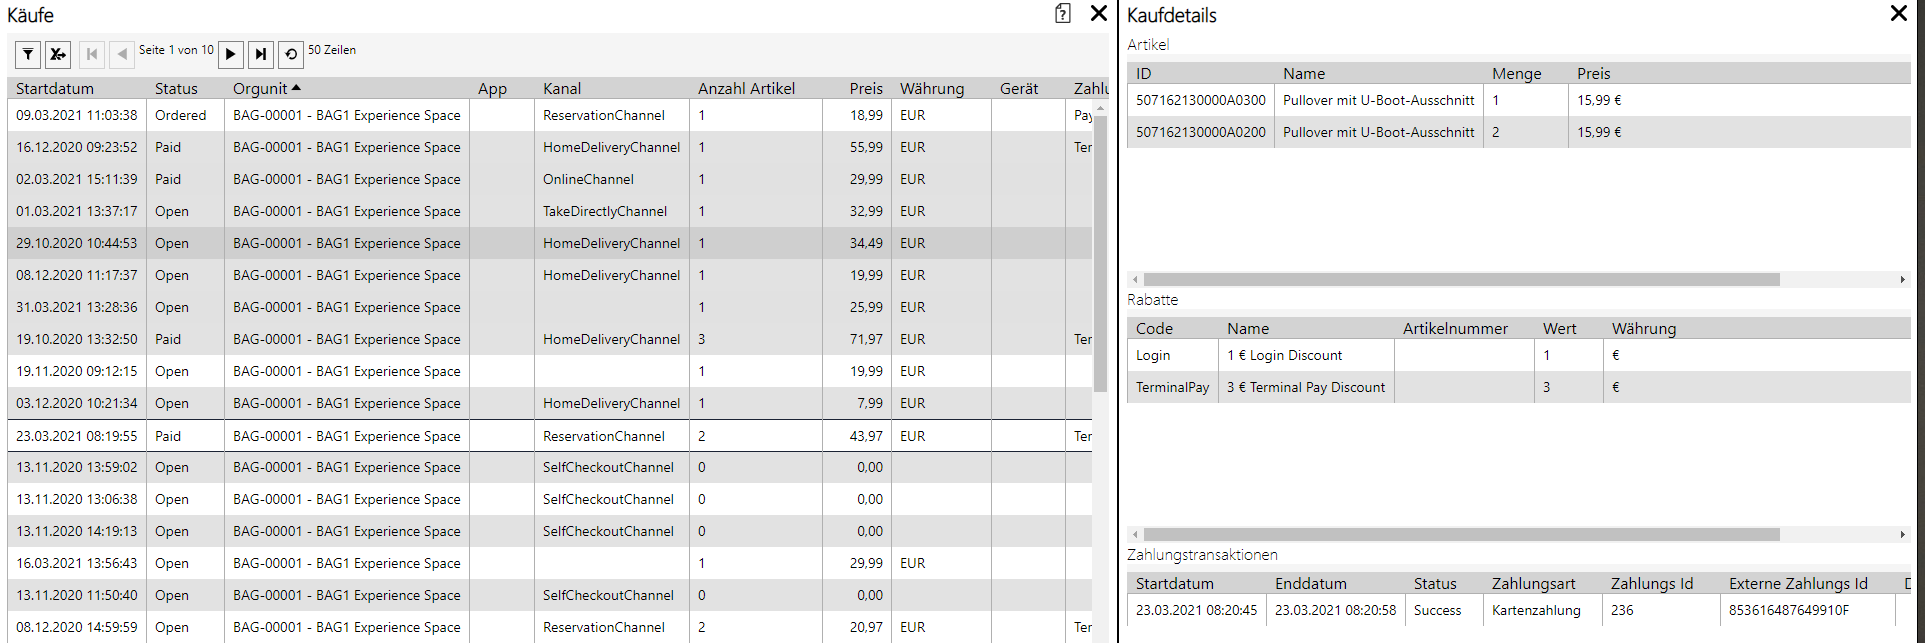
6. Sales
... provide insight into which checkouts have been made via which devices.
Offers added value because:
These statistics are about the most decisive factor in retail: sales. Not only can it be determined which device generated the most sales, but also whether the purchase was completed, which delivery channel was selected, the method of payment, the attempts, etc. There is hardly a better table that can show the ROI and acceptance of a (Self ) Assess checkout application.
Double-clicking a purchase reveals more details, such as whether discounts or coupons have been applied.
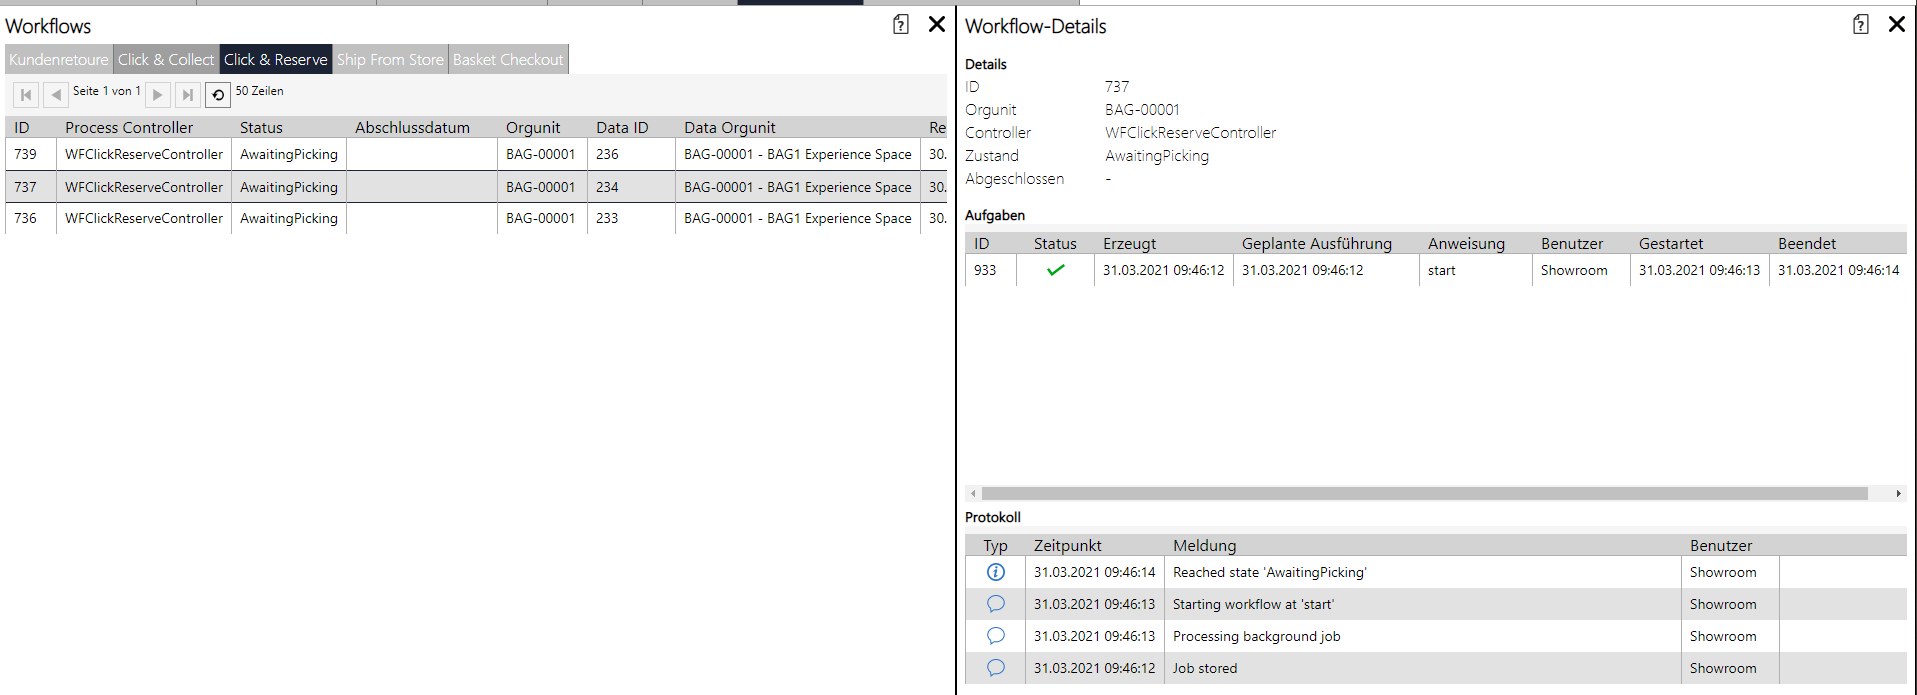
7. Workflows
... give an overview of incomplete omnichannel processes.
Offers added value because:
The workflow view focuses on the individual technical steps behind an (omnichannel) process. If there is a problem in the backend, the error can be more easily traced thanks to the list of steps. This view is primarily intended for IT.
8. Omnichanel processes
... supplement the above-mentioned workflows with further details and a preview of the articles.
Offers added value because:
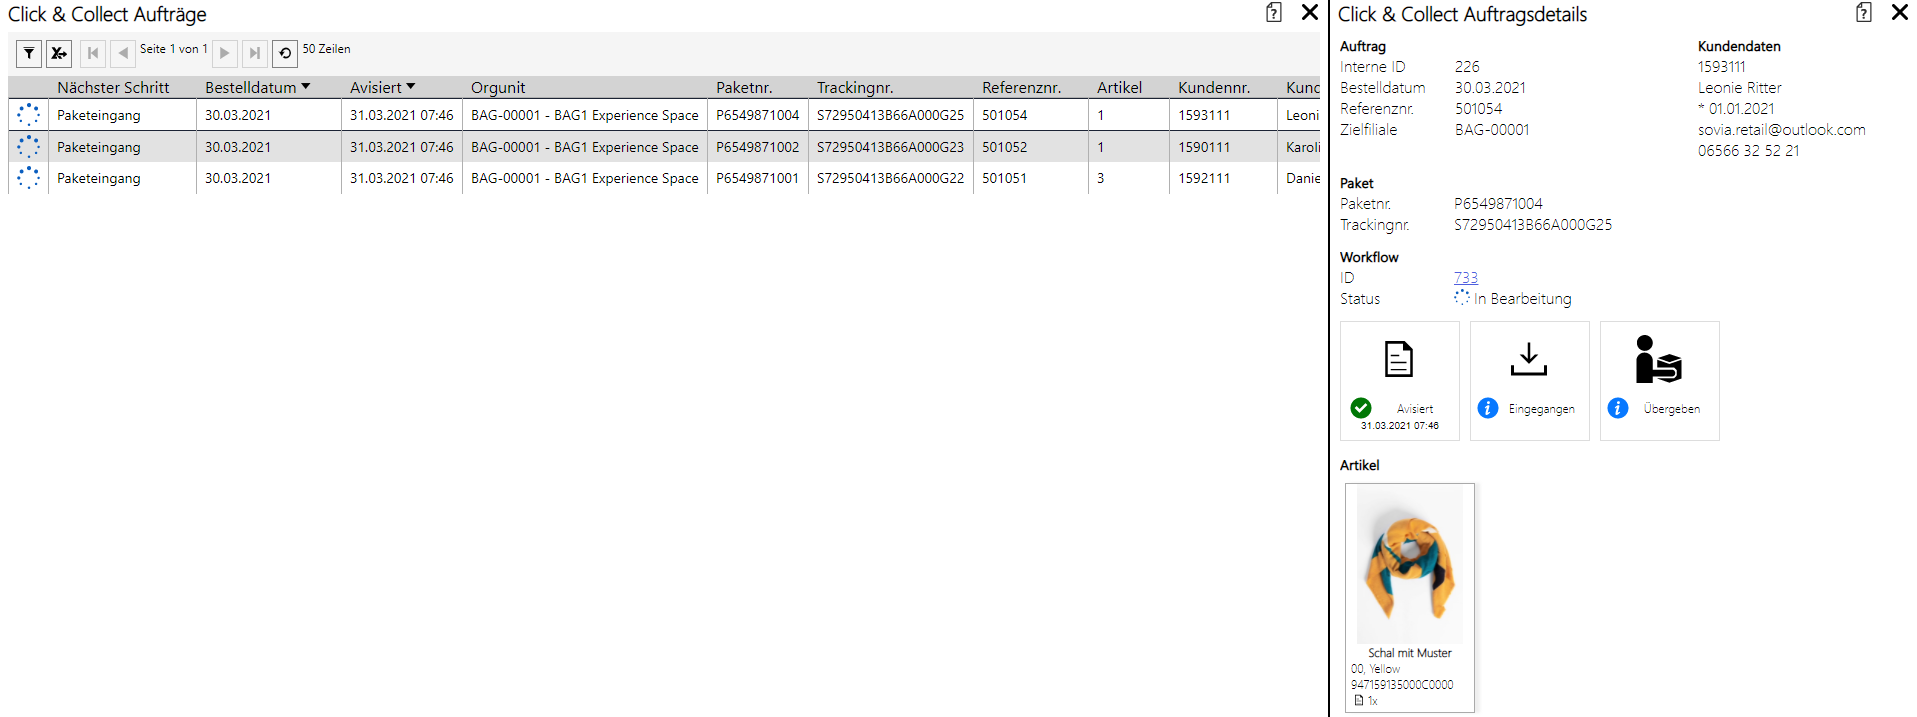
A quick glance is enough to see open Click & Collect, Click & Reserve or Ship from Store processes. This dashboard is a good overview, especially for the support staff, to inform end customers about the status of their order and, thanks to the package tracking number, to get to the bottom of possible delays. The exact items in the package are also shown here.
