Insights
soviaRetail has various telemetry and analysis functions. On the one hand, statements can be made to the second about promotional items that have been played out, and on the other hand, detailed insights into customer behavior can be gained using the interactive solutions.
Telemetry data is automatically recorded at central points in the internal workflow of the framework. These registrations completely cover the health analysis. Great importance is attached to ensuring that the acquisition of telemetry data does not affect performance.
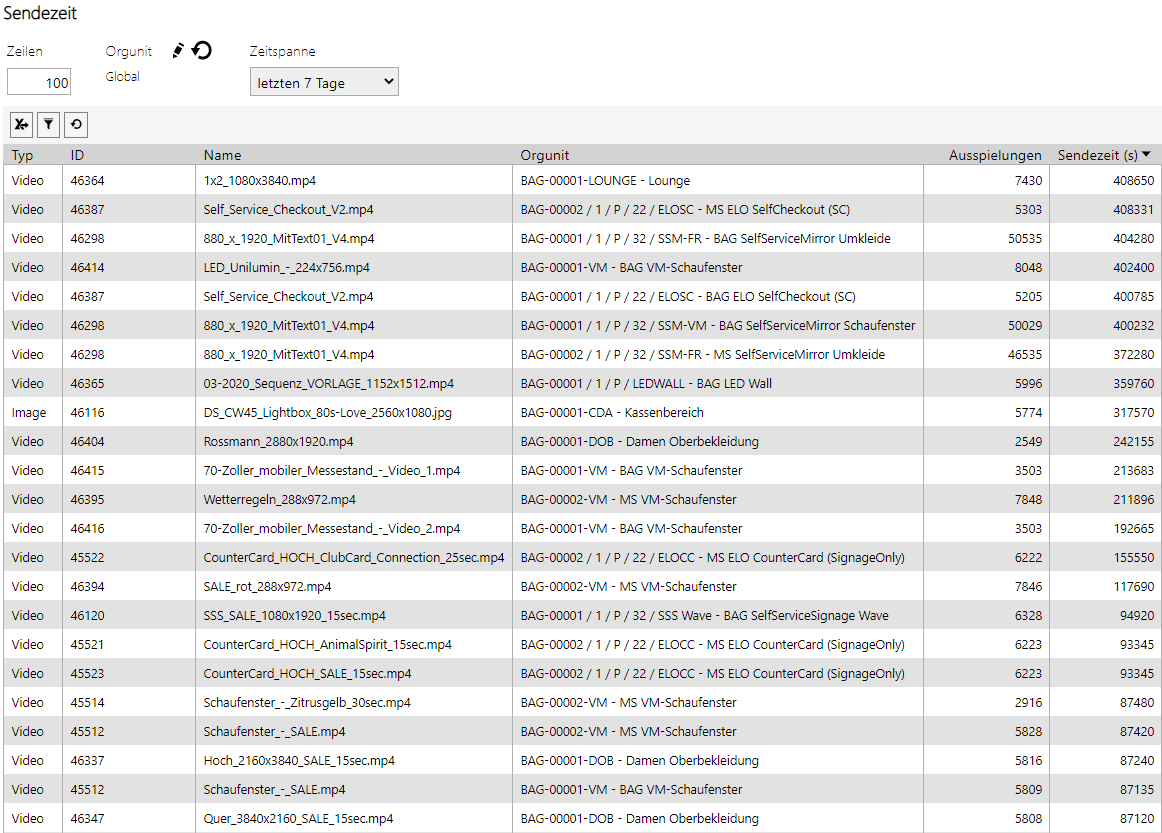
Transmission time evaluation
These statistics provide information about how often and how many seconds in total e.g. a video was played. For example, if a customer wants to sell airtime to a third party, he can precisely prove and bill the seconds actually played out in the clip.
Metrics/KPIs
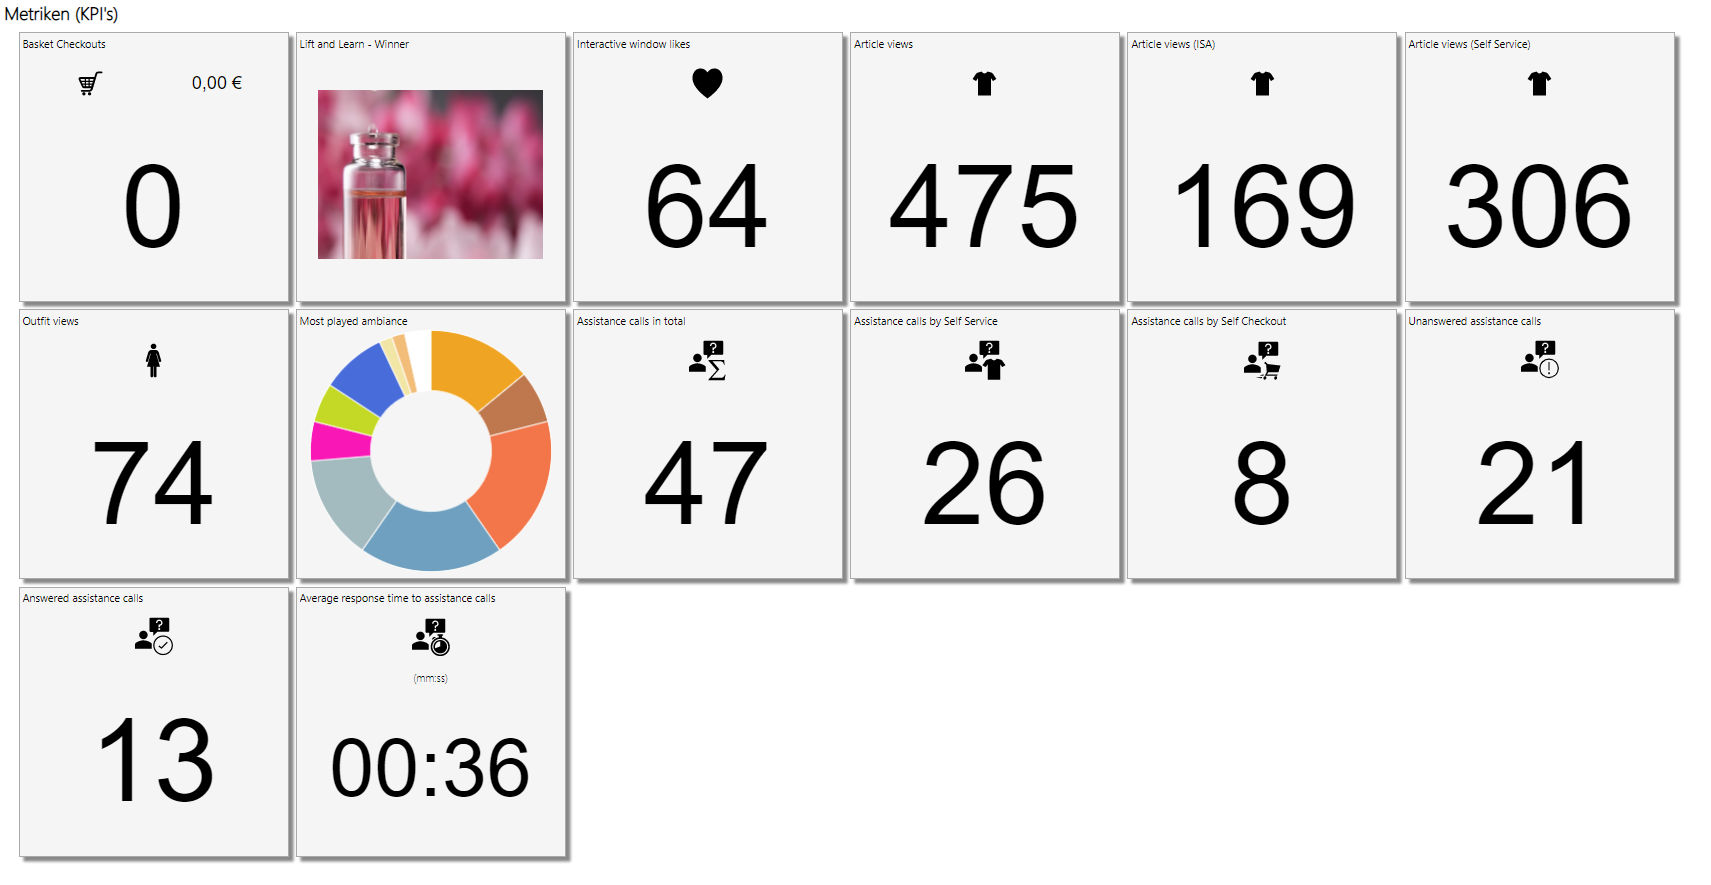
This is where data comes together that is collected from interactive digital signage applications. The application examples are varied and individually adaptable. For example, it can be determined which product was lifted most frequently at Lift & Learn - and thus was probably the most interesting for the customers. It is also possible to determine which outfits or individual items were viewed most frequently, how many purchases have been made or how long it takes on average for an employee in the area to react when a customer calls them at the push of a button on Self Service.
Device metrics
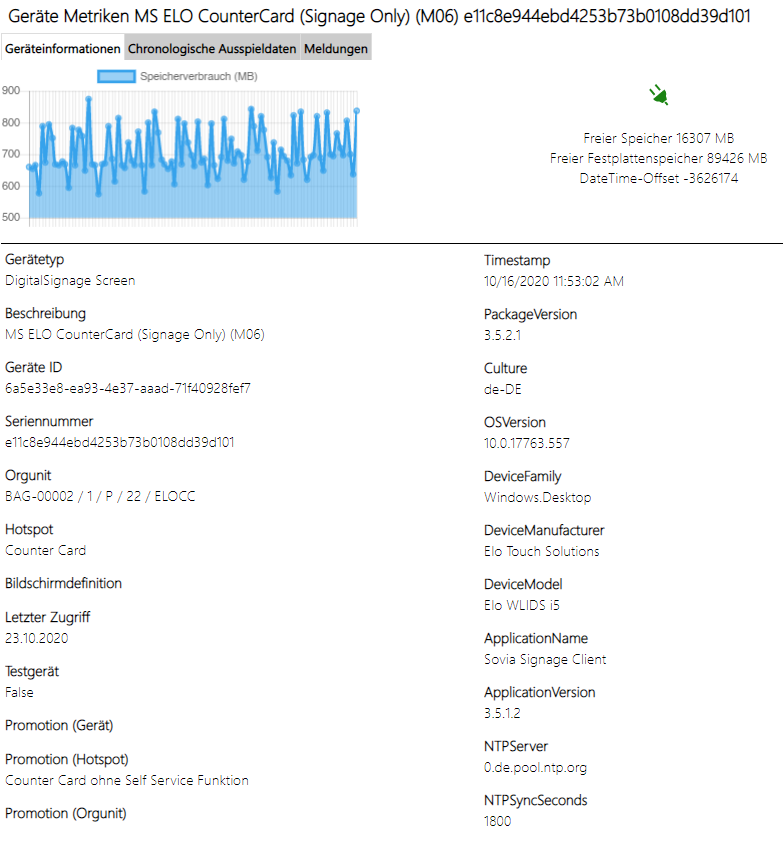
Detailed statistics can be queried for each digital signage device, which help in the maintenance of the device. The device Information window shows the storage requirement in real time and shows how much hard disk space is free and used. You can also see whether the DateTime offset is correct - i.e. whether the time of the device corresponds to that of the connected server. In addition, the device metrics provide information on configurations such as device names, software versions, last access and active promotions. This helps to understand mistakes. Upon request, critical fluctuations can be notified by email. You can also read which promotions were run on this device.
At a glance
- Information on how long and how often a promotion item was played
- e.g. to bill the broadcast times sold to third parties
- KPIs from interactive digital signage. For instance, shopping cart statistics, 'liked' products, outfits viewed, etc.
- Detailed device metrics help with error analyzes and provide information about the configuration of signage devices.
